⌁ OCEANS Apps ⌁
Instruments
you can steer by.
Purpose-built tools from OCEANS LLC. Live on the open web, free to use, no login. We build them the way we engineer for our customers: every number traceable to its source, every limit stated out loud.
FAA data through Jun 2026
New York, NY · 881 reports
Live render from SKYWATCH's data: every FAA UAS sighting place since Feb 2016, at its city centroid. Red contacts sit within 10 nm of a military installation, mostly because cities and bases share ground. Hover a contact to read it.
Counter-UAS Incident Atlas
SKYWATCH
Every drone sighting the FAA has logged, mapped against the infrastructure that matters.
The FAA publishes its UAS sighting reports as quarterly spreadsheets: a date, a city, and a pilot's narrative. No coordinates, no context. SKYWATCH geocodes all 16,639 of them and lays them over 654 military installations, 917 airports, 2,257 FAA no-drone zones and 1,940 power plants, with a curated international incident layer for perspective. One operator view of the domestic drone picture.
16,639
FAA sighting reports
Feb 2016 – Jun 2026
10
Years of records
Archived quarters recovered
5,786
Infrastructure sites
Bases, airports, no-drone zones, power, ports
1,749
Reports, last 12 months
The current window
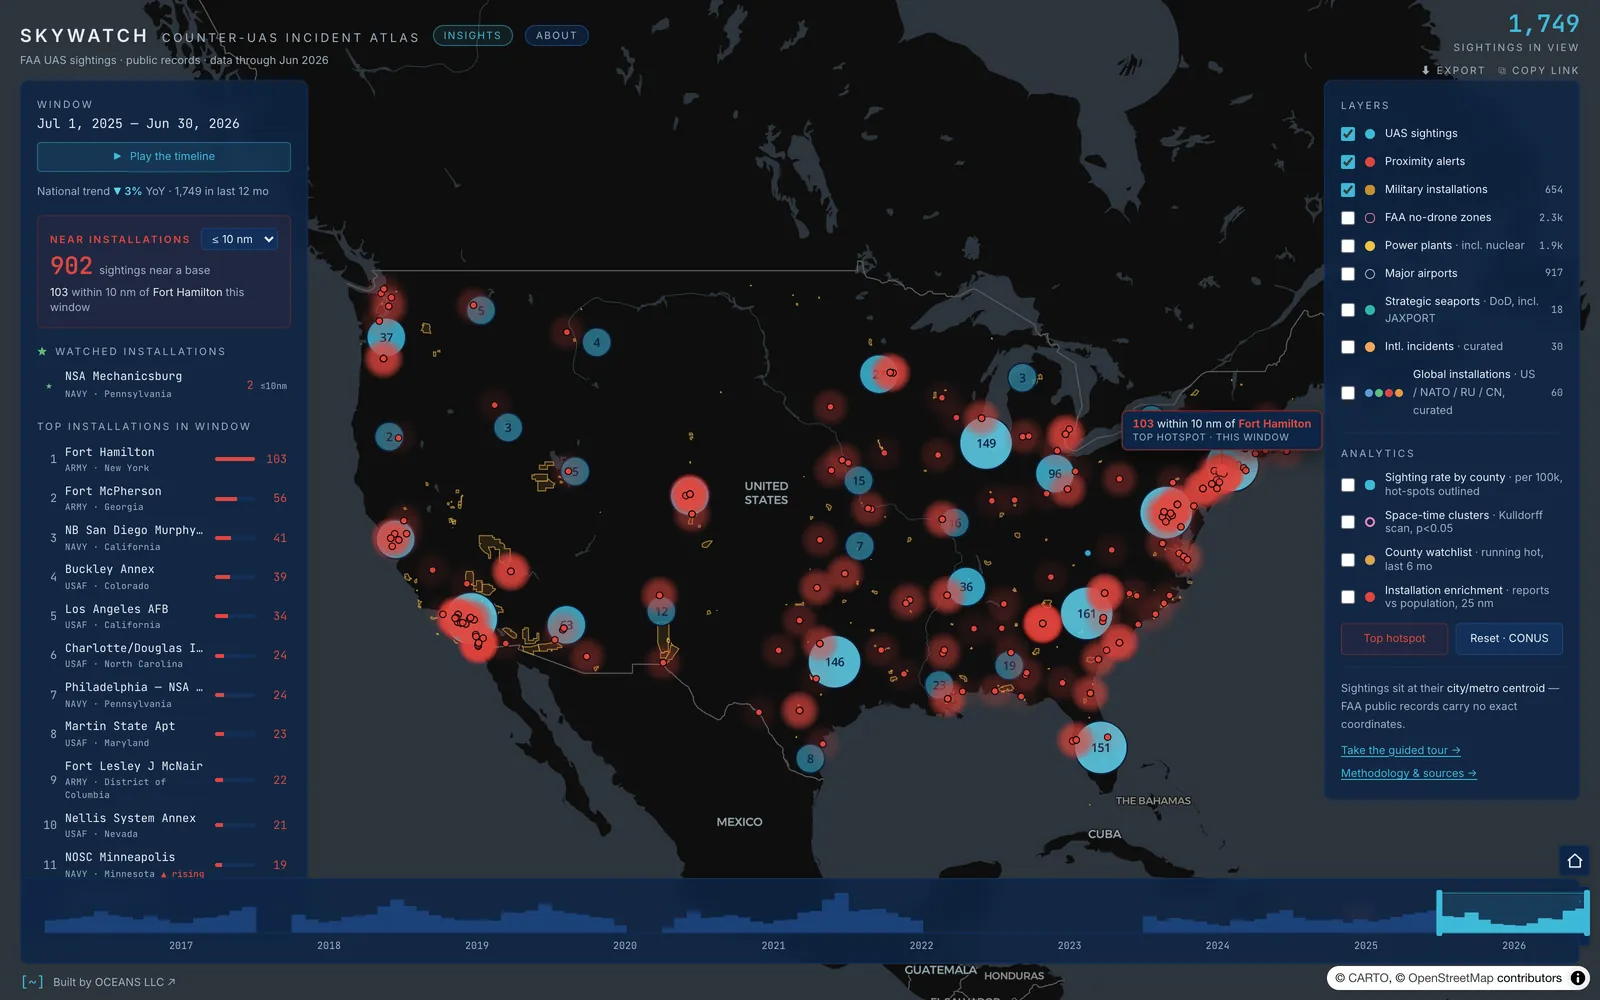
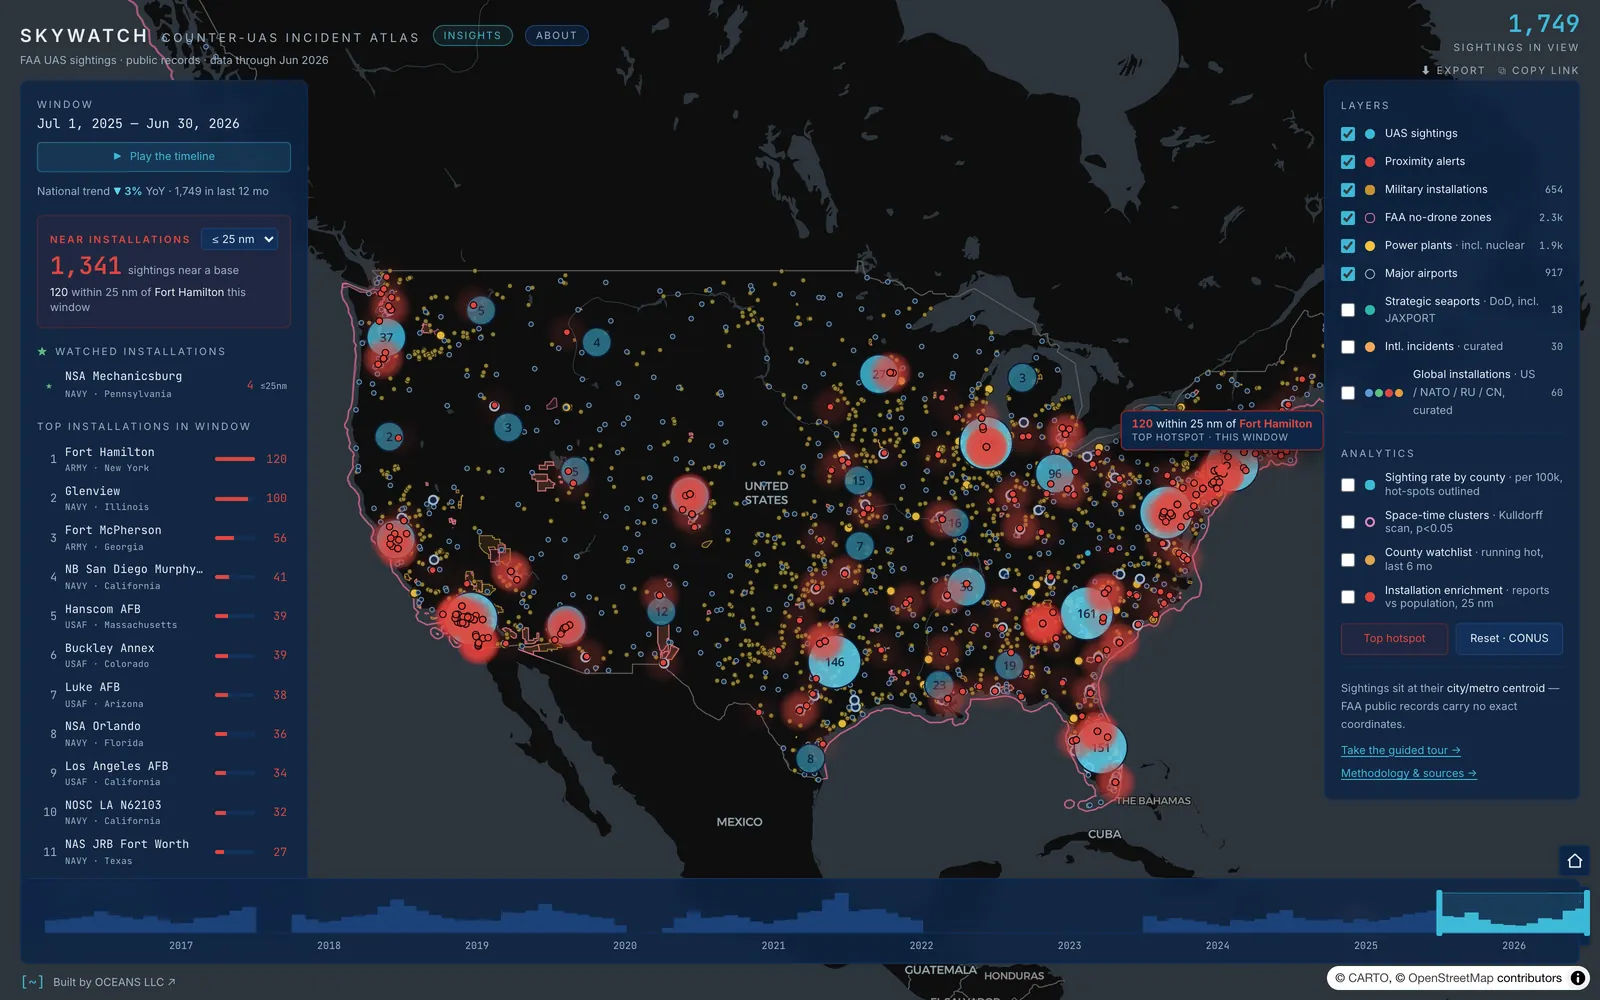
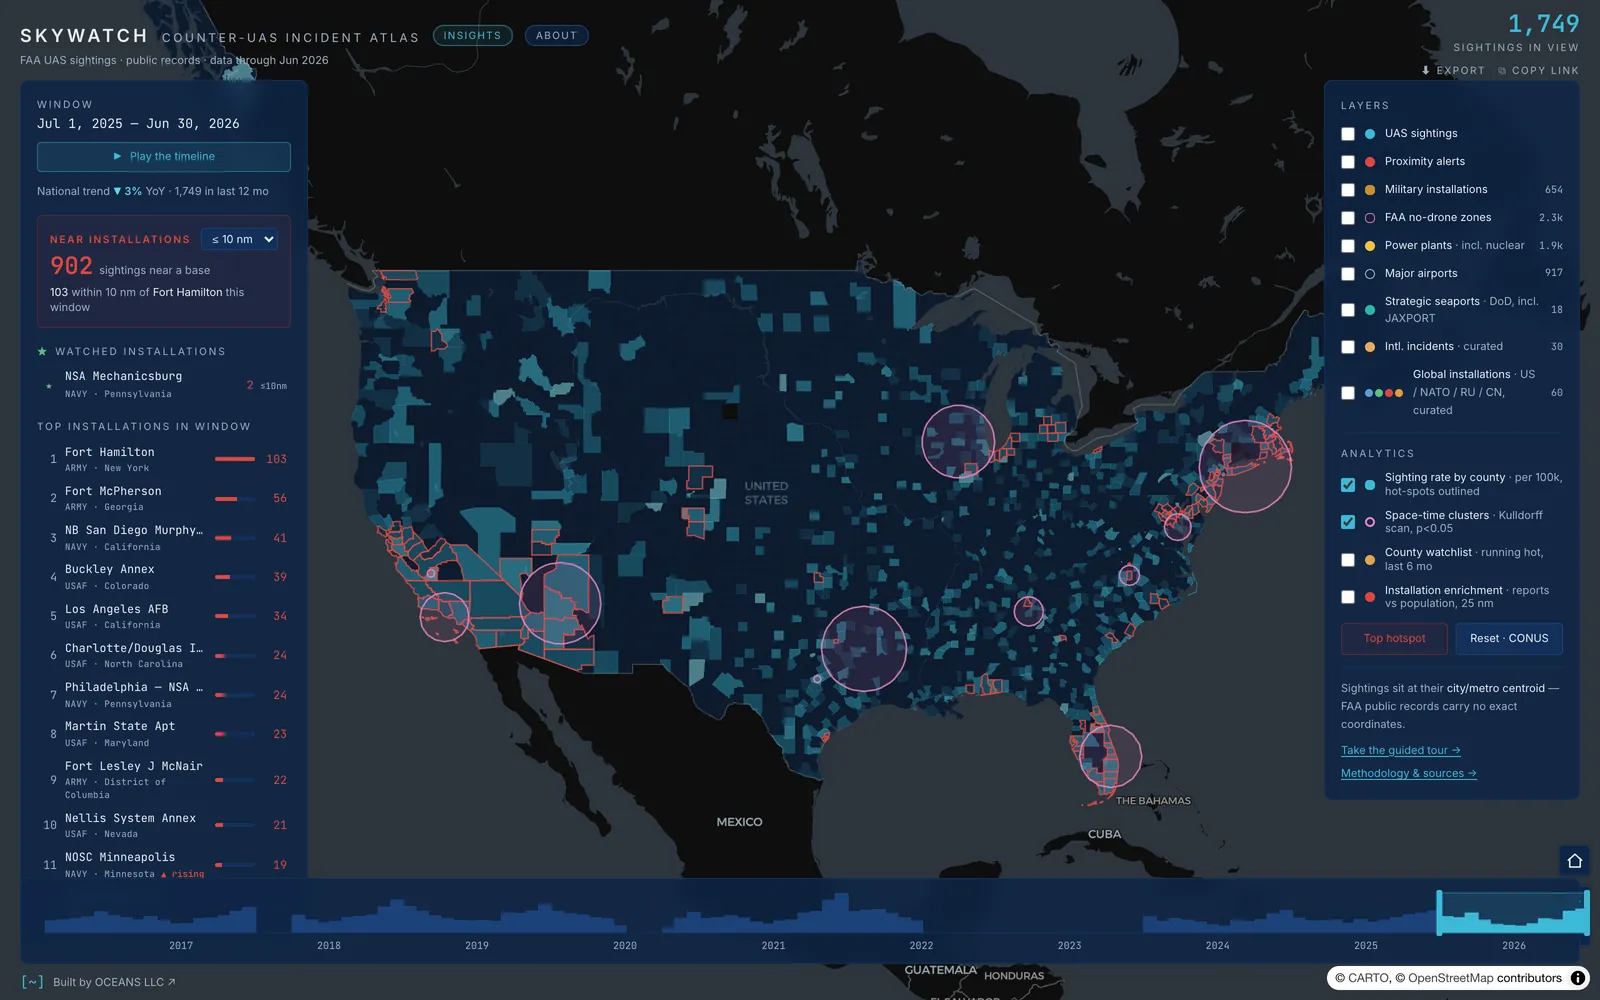
Sightings within 5, 10 or 25 nm of an installation glow red. The side panel ranks installations by nearby reports in the current window and flags the ones that are rising.
10 years of reports, month by month.
Hover a bar, or focus the chart and use the arrow keys. This counts what people phoned in, so it tracks reporting habits as well as drones.
Proximity alerts
Pick a 5, 10 or 25 nm radius. Installations rank by nearby reports, with rising-trend flags and fly-to on click.
Time scrubber
Drag any window across 10 years of records, or press play and watch the timeline roll month by month.
Space-time clusters
Kulldorff scan statistics at p < 0.05, county rates per 100k, and a watchlist of counties running hot over the last six months.
Insights
A negative-binomial model across US counties separates real signal from plain population, with every statistical term defined on hover.
Global frame
30 curated international drone incidents and 60 US, NATO, Russian and Chinese installations put the domestic picture in context.
Built to hand off
Every view is a shareable link. Search the pilot narratives, export a branded PNG, or take the 14-step guided tour.
Public sources only
- FAA UAS Sightings Reports
- US Census Gazetteer
- HIFLD
- OurAirports
- FAA National Security UAS Flight Restrictions
- USDOT / BTS
- ACLED
Traceability & Lossiness Analysis
ATLAS
Trace a requirement from intent to the hardware on the ground, and see exactly where the information goes missing.
Big programs keep their architecture in three places: a traceability matrix, a stack of site diagrams, and the heads of the few people who were there. ATLAS reads the first two together and measures what falls out between the requirement, the system and the device. Seven lossiness dimensions, each opening onto the entities behind the number, because a gap you cannot name is a gap nobody can close.
Where the thread breaks.
The seven things ATLAS measures
Seven measures of what falls out between the requirement, the system and the hardware. Pick one to see where it bites.
Schematic · illustrative, not drawn from any dataset
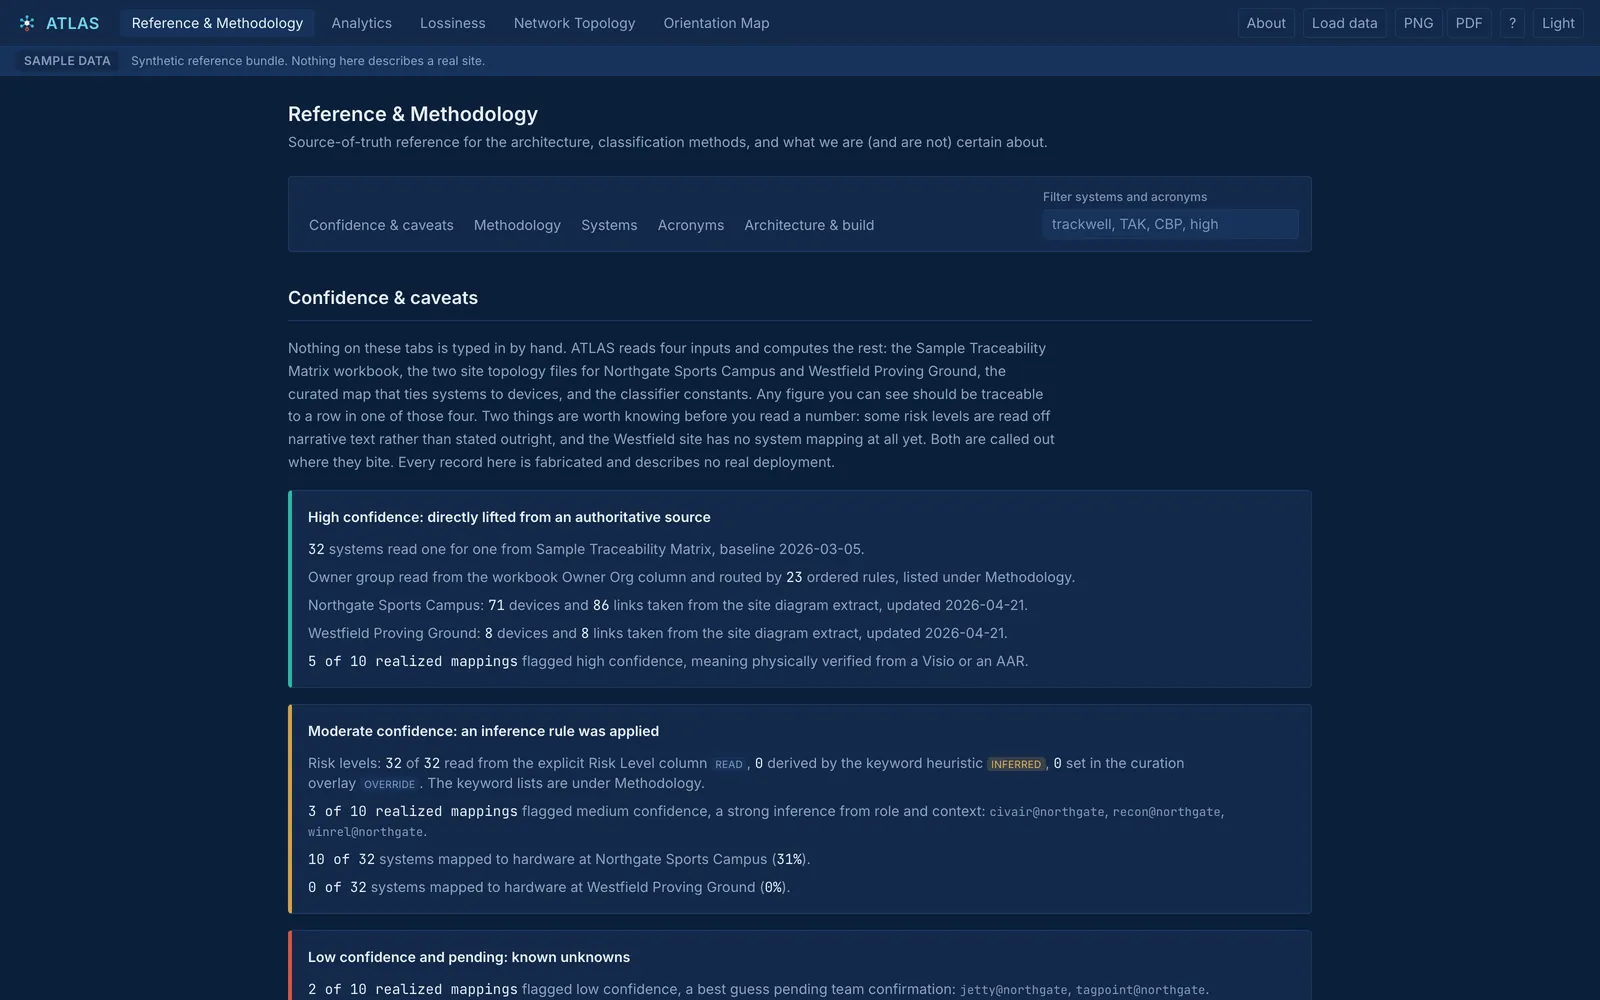
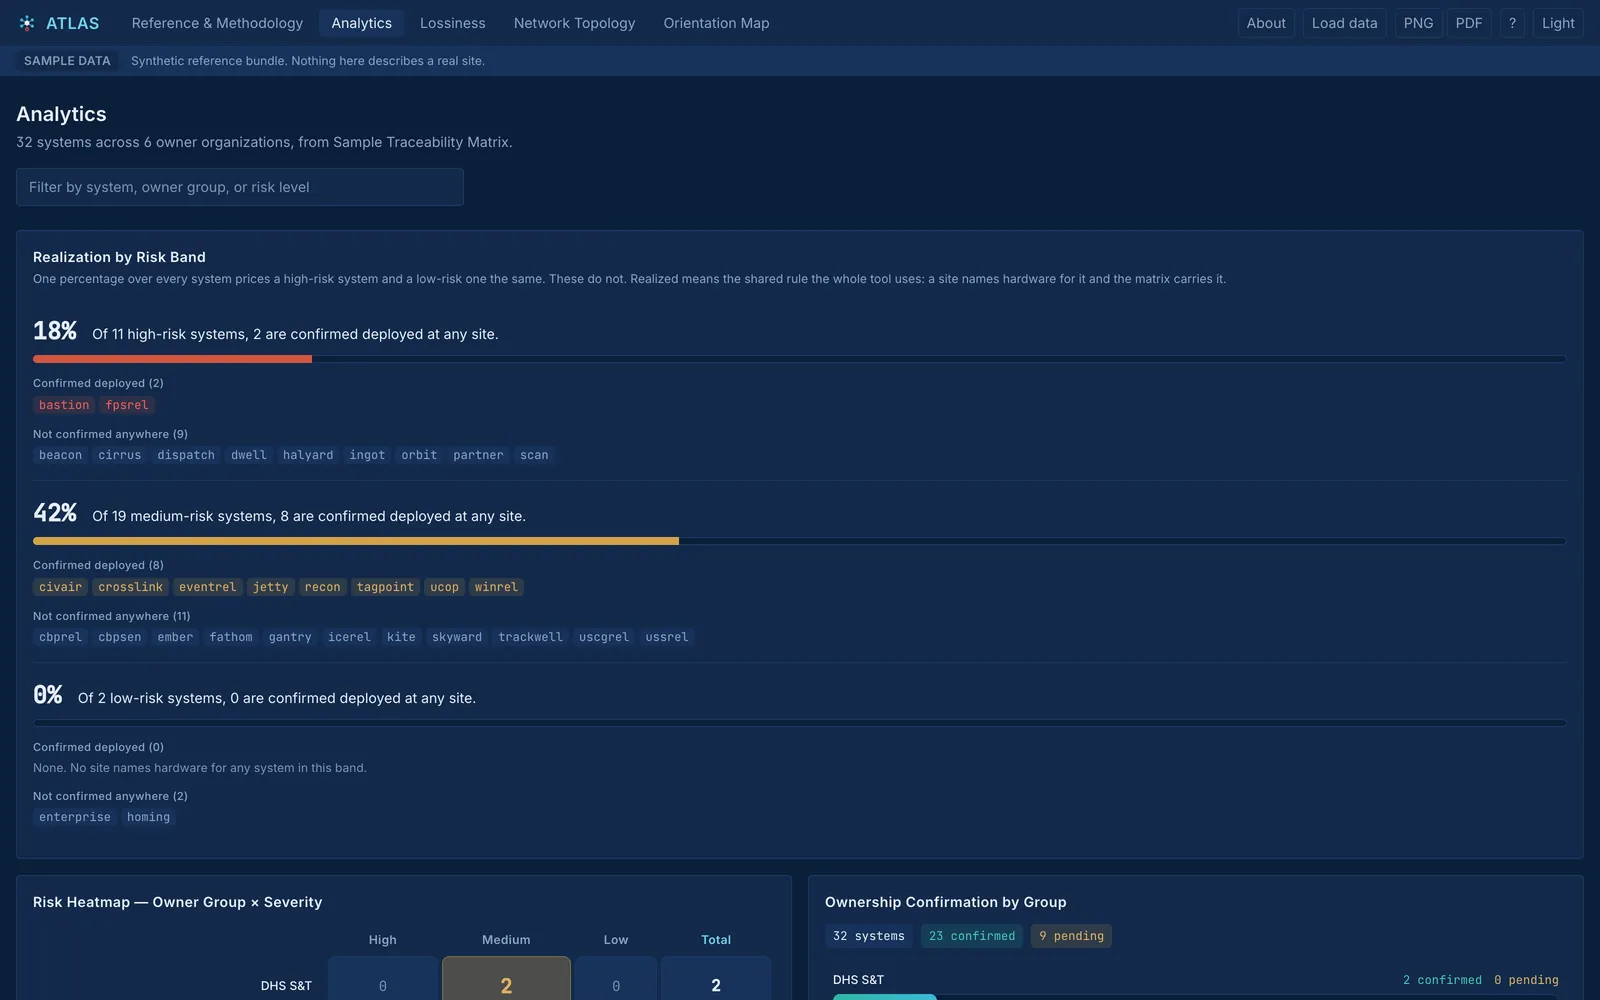
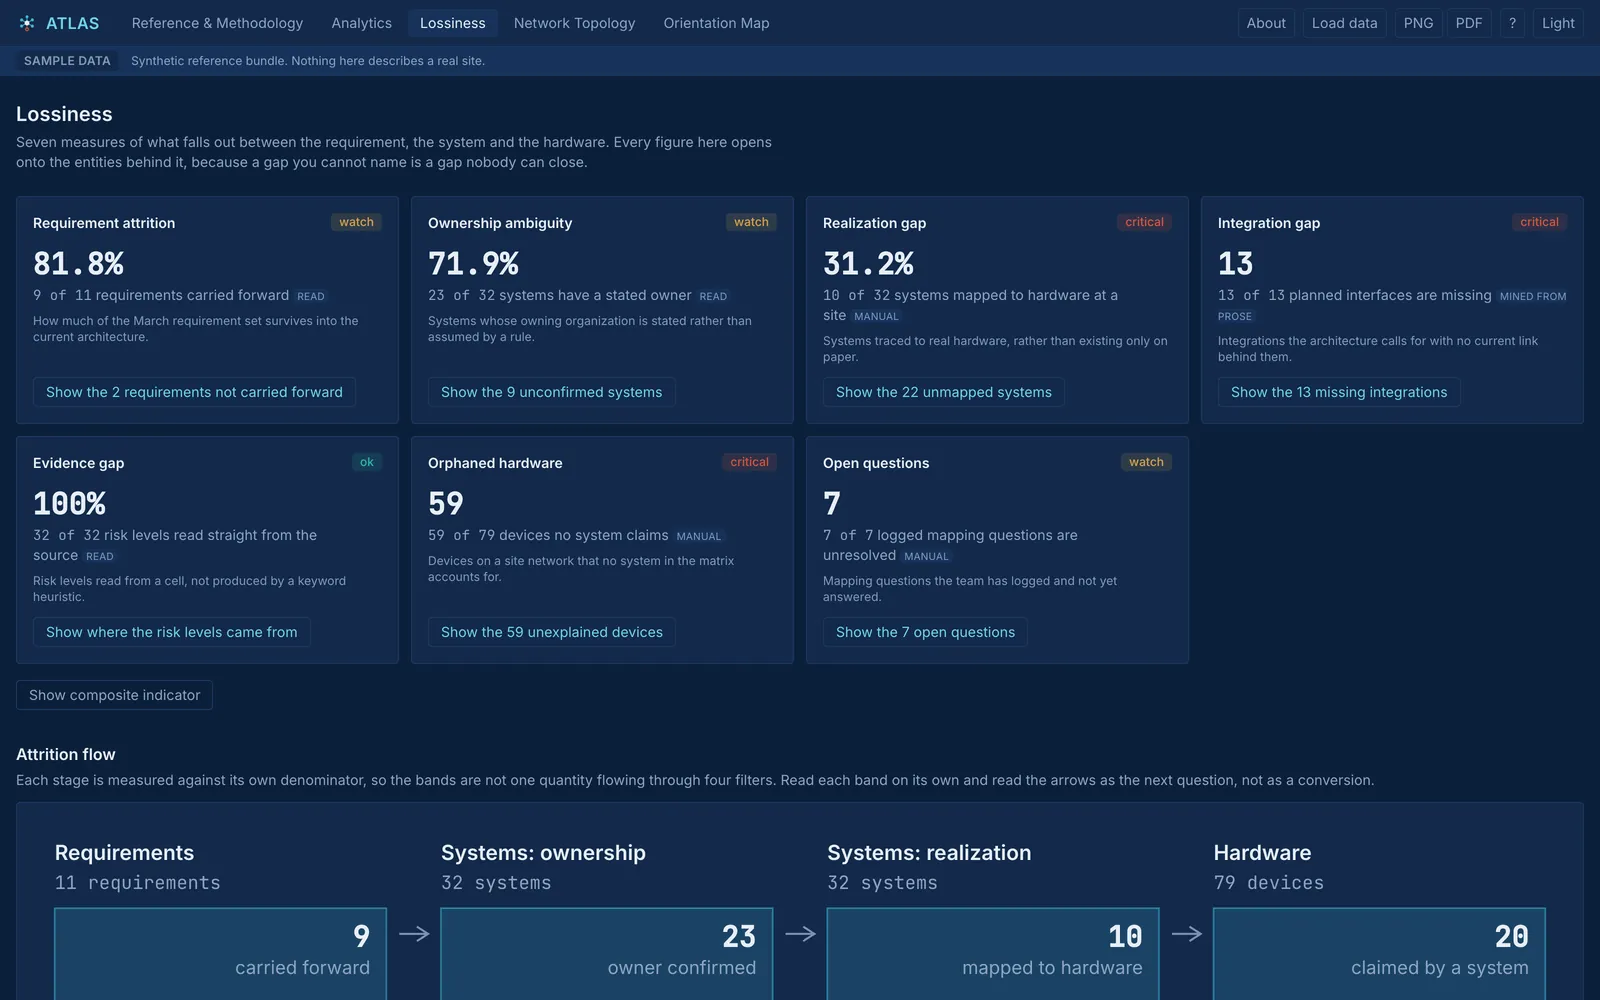
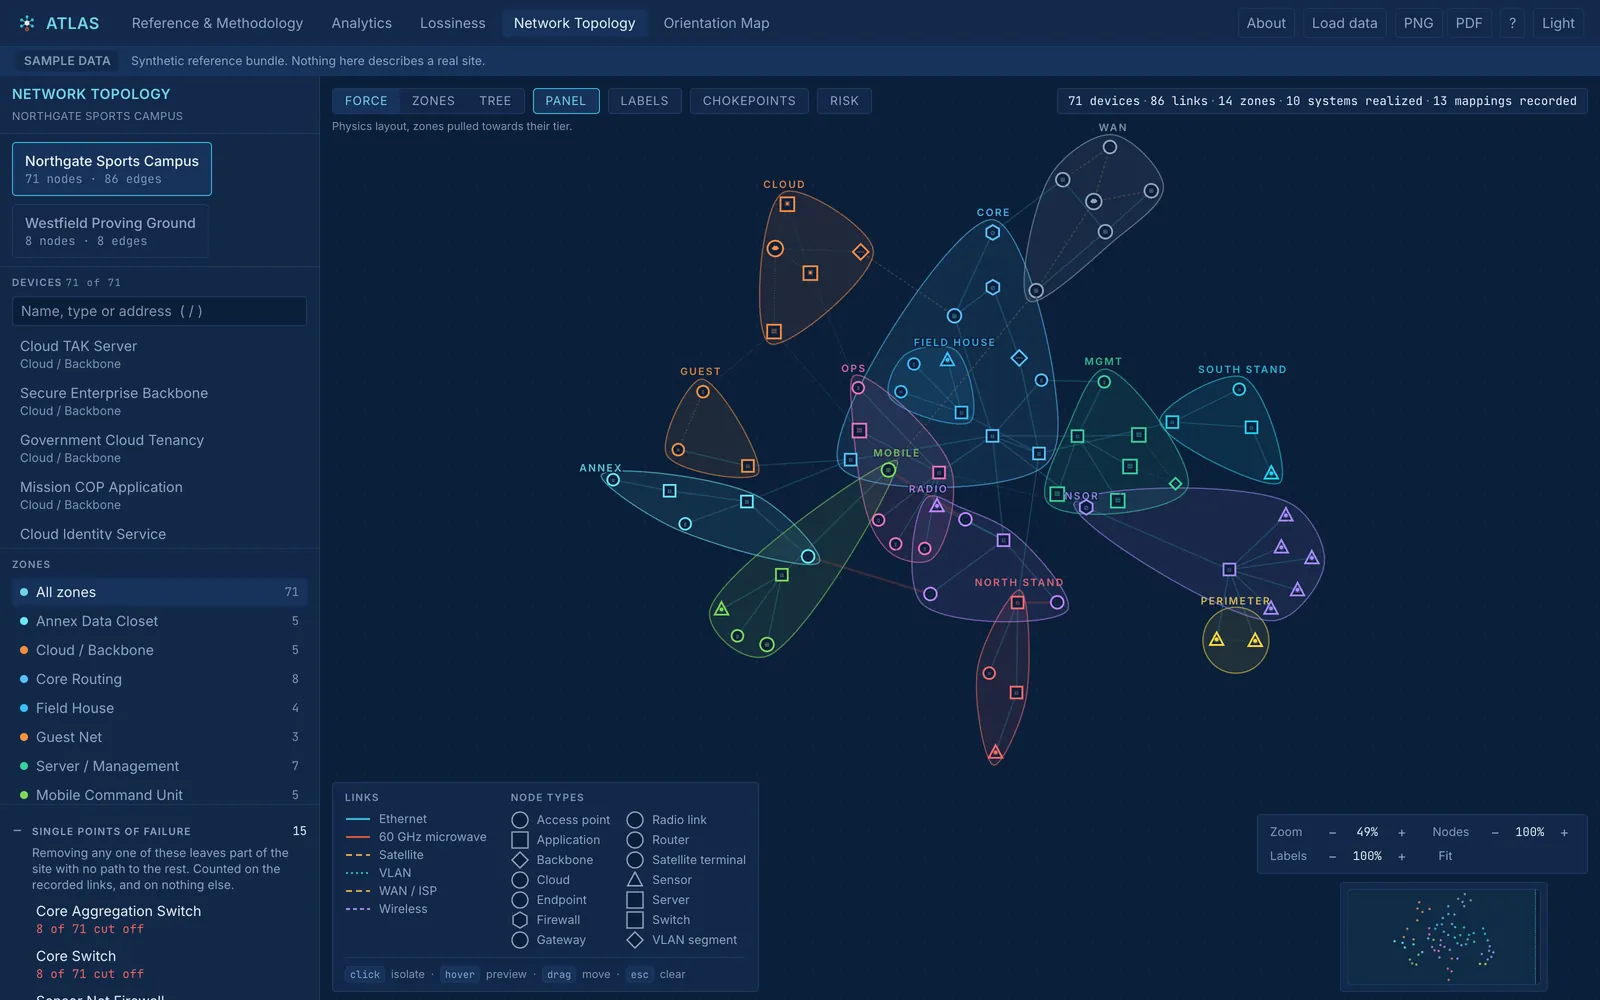
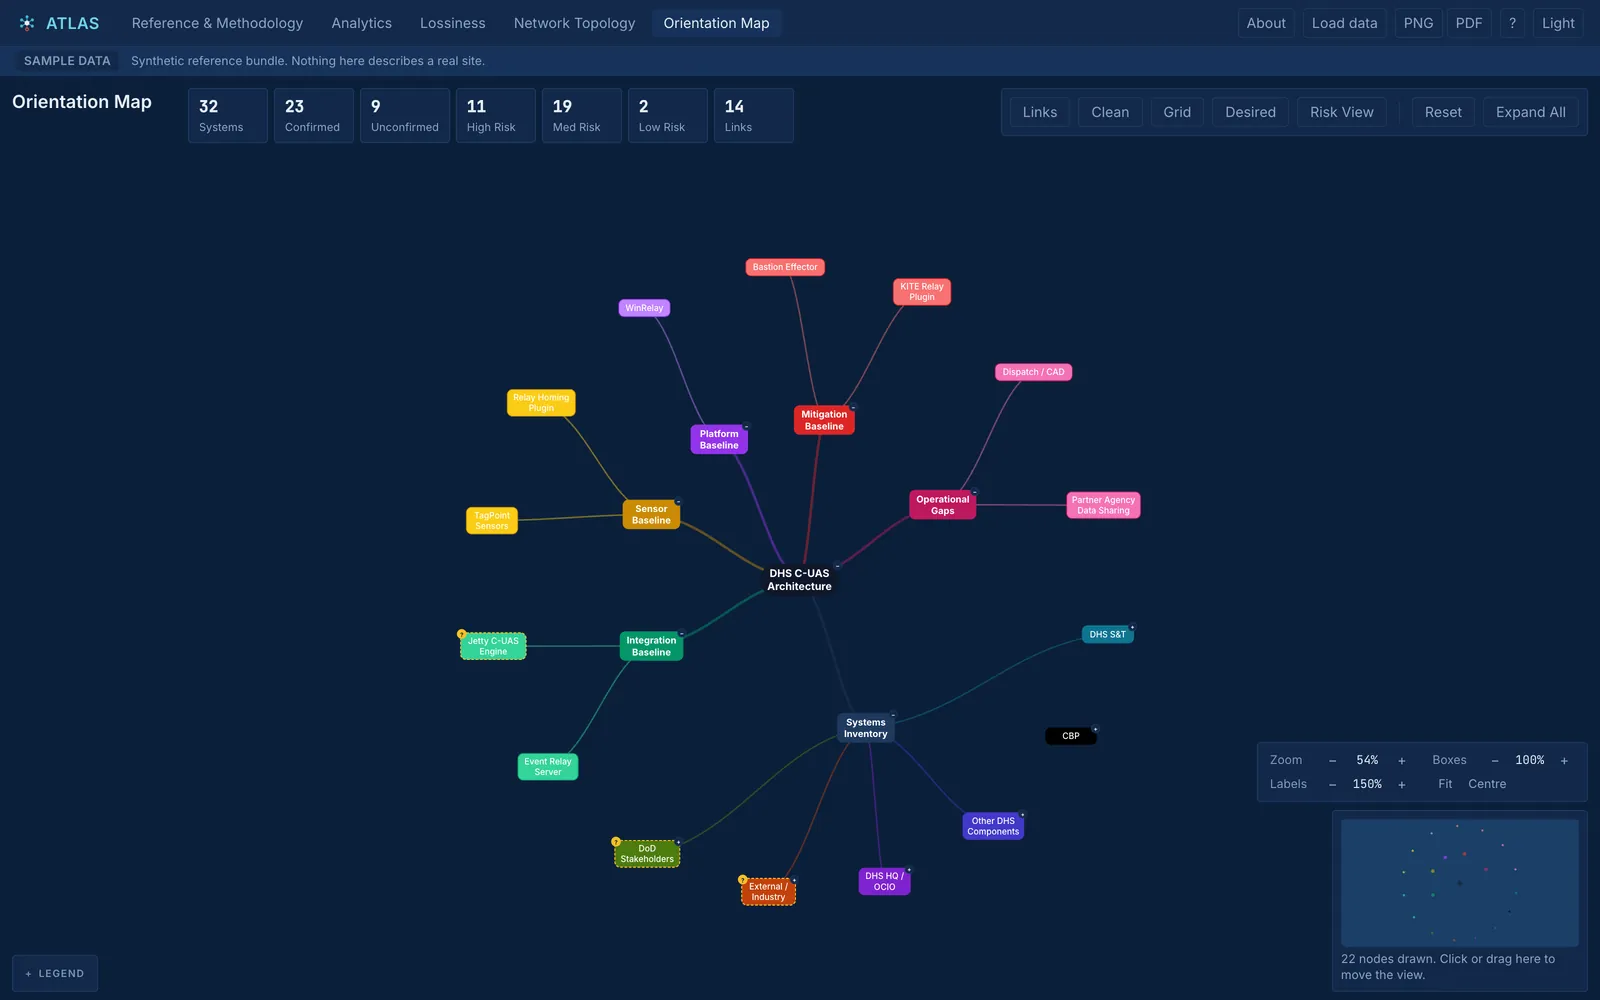
What every term means, how each figure was derived, and a confidence ledger that separates what was read from a source from what was inferred.
Built for sensitive work
The safest server is the one that doesn't exist.
Your file never leaves the tab
Load your own traceability matrix and ATLAS parses it in the browser. No upload, no server, nothing written to storage. Open the network panel while it loads: it stays empty.
Works air-gapped
The whole app builds to one self-contained HTML file with every asset inlined. The build fails if a remote reference sneaks in, so the claim is enforced, not asserted.
Markings burned in
A stated control marking is drawn into every PNG and PDF and written into every CSV. Pixels survive a copy and paste. Metadata does not.
No number without evidence
Every figure carries the IDs of the entities behind it and drills through to them. A metric you cannot audit is a claim, not a measurement.
Empty is not broken
“No data” and “failed to load” are separate components, so a dead fetch can never pose as a zero on a chart.
Nothing persists
No local storage, no cache, no service worker. Close the tab and the data is gone, and a test fails if that ever changes.
The hosted ATLAS runs on a fabricated sample bundle; nothing in it describes a real site. ATLAS has no accreditation for controlled information, and whether your data may be handled this way is a determination for you and your data owner.
⌁ how we build ⌁
One standard, every instrument.
The two apps answer very different questions. They are built to the same rules, the ones we hold our customer work to.
Show the evidence.
Every point in SKYWATCH opens onto the FAA record behind it. Every figure in ATLAS drills to the rows that produced it. If we can't show where a number came from, it doesn't ship.
Say what you don't know.
SKYWATCH prints the geocoding precision of every placement. ATLAS treats an unmapped site as an absence of evidence, not evidence of absence, and says so on screen.
Nothing to trust but the code.
No accounts, no backend, no trackers. Static files, your browser, and either public records or data that never leaves your machine.
Built for the watch floor.
A link for every view, exports that carry their context, guided tours for the first visit. Tools one operator can hand to the next shift.
Side by side
| Attribute | SKYWATCH open ↗ | ATLAS open ↗ |
|---|---|---|
| The question | Where are drones being reported near the things that matter? | Where does the architecture lose information between intent and deployment? |
| Data | FAA public records and six public overlay sources | A synthetic sample bundle, or your own matrix, parsed locally |
| Coverage | Feb 2016 – Jun 2026 · 16,639 reports | Five views · seven lossiness dimensions |
| Runs on | Any modern browser, fully client-side | Any modern browser, or one offline HTML file |
| Login | None | None |
| Exports | Branded PNG, shareable links | PNG, PDF, CSV with control markings |
| Built with | TypeScript · MapLibre GL · D3 | React · TypeScript · D3 · SheetJS |
⌁ commission an instrument ⌁
Your mission has a question.
Let's build the instrument.
We build these the way we engineer for our customers. If your program has a question that deserves a purpose-built tool, tell us about it.